
Introduction to Neural Networks
How and why do neural networks work? The first in a series about understanding how neural networks learn to separate and classify visual data.
What Are Neural Networks?
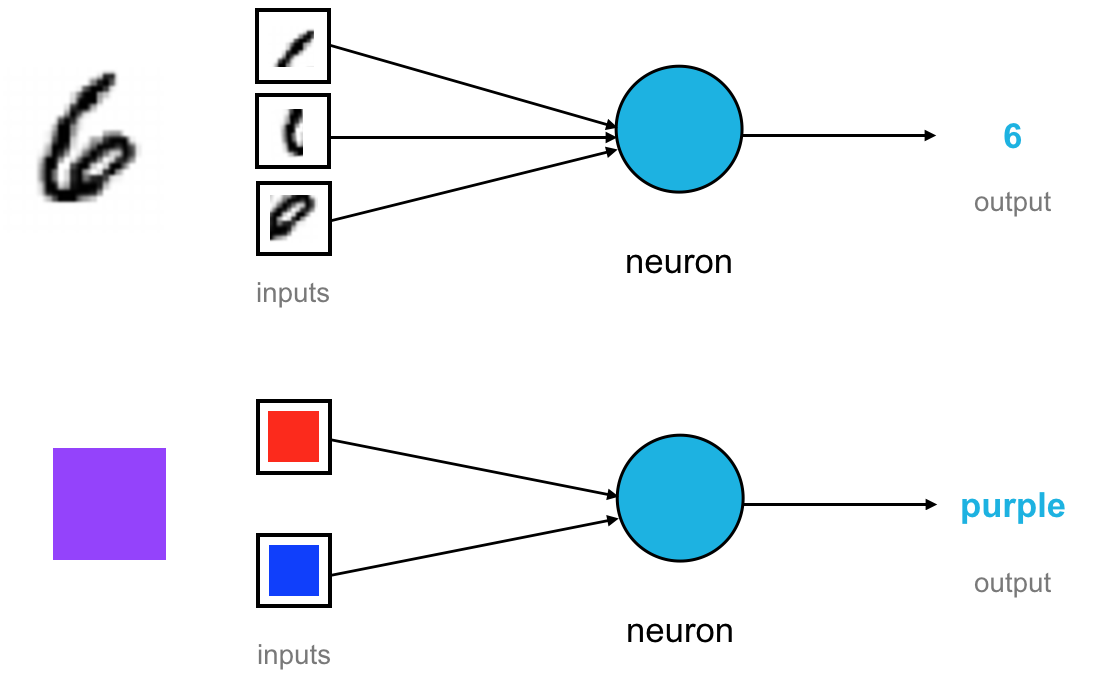
Neural networks are made up of neurons, sometimes called nodes. One neuron is responsible for processing some input data and producing an output. This is modeled after the neurons in our brain, which process input signals and produce output signals. For a neural network that processes visual data, such as a set of images, these inputs will be either spatial information or color information. When these color components or shapes are combined, which happens inside a neuron in the form of an equation (ex. 0.5*red and 0.5*blue = 1*purple), it produces an output signal that can do something like help classify the initial input!
By looking at many many combinations of both shapes and colors, a neural network can recognize more and more complex patterns in images. You’ll often see neural networks represented by figures like these:
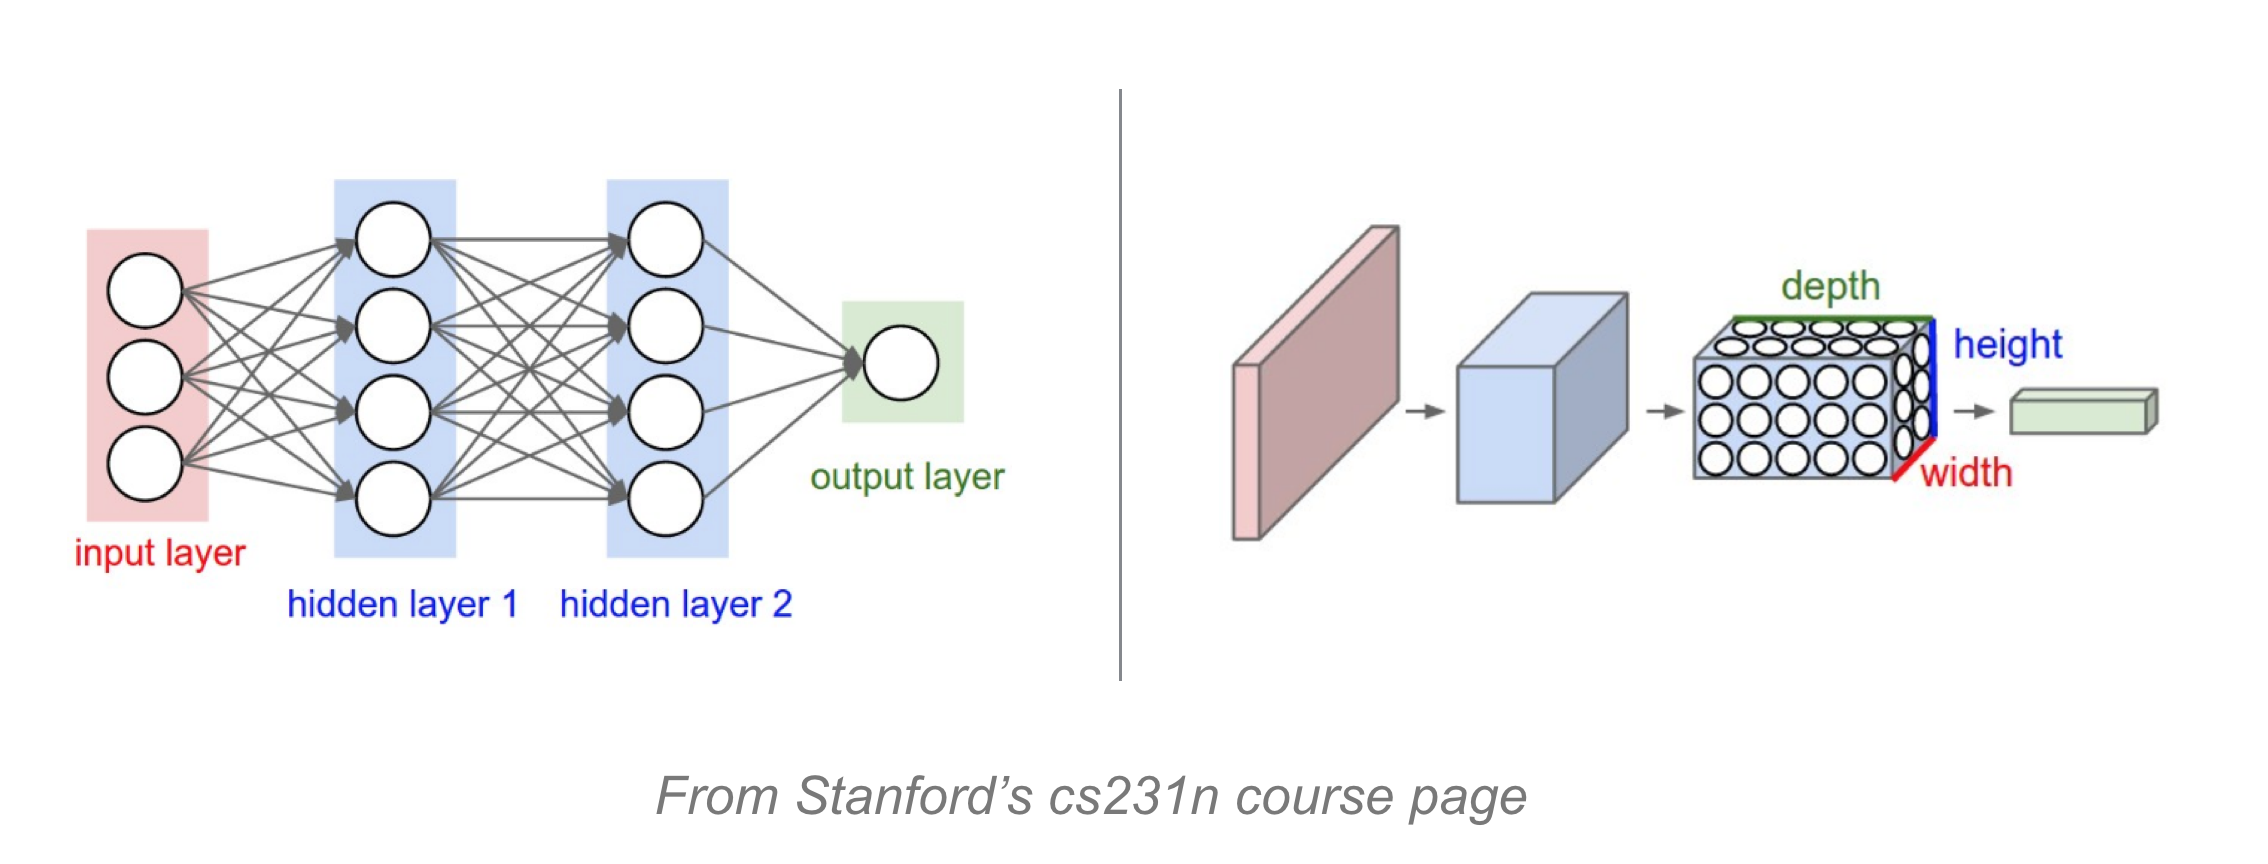
These neural nets have some input data and some output, and in between, they have many layers. The layers are made of nodes and the output of one node acts as the input of another node down the line; each of these nodes can learn to extract information about the colors and shapes that make up an image, and use a combination of those things to produce something like a class for an input image.
Why Do Neural Networks Work?
Now, why exactly do neural networks work? This wasn’t exactly clear to me when I first started learning about them, and it doesn’t help that NN’s’ are often described as “black boxes” or some kind of “magic,” but why they work can be concisely explained.
- Any set of data, such as a set of images, can be represented by a smaller, simpler model.
- A model is made of a combination of visual features: a few colors and/or shapes.
The idea is that if a set of image data can be broken down into a finite set of shape and color features, then we can learn how to group and classify any image based on which of these features it contains. The big assumption here is that any set of data can be represented by a smaller model. This is true of any set of data with one exception. The only case where a set of data cannot be broken down into a simpler mode is in the case of random data; for any other kind of data, there will be some pattern that can be detected.
Classifying Colors
Let’s see how creating a model works by building one ourselves and creating a model for color classification.
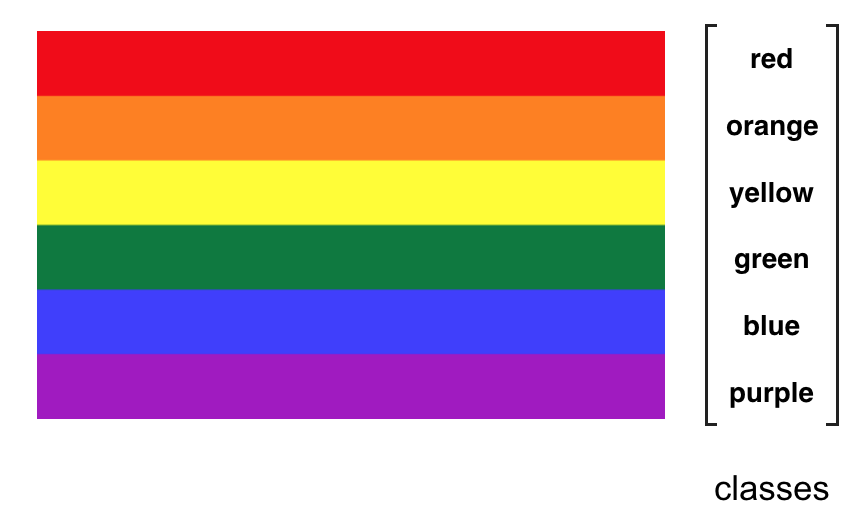
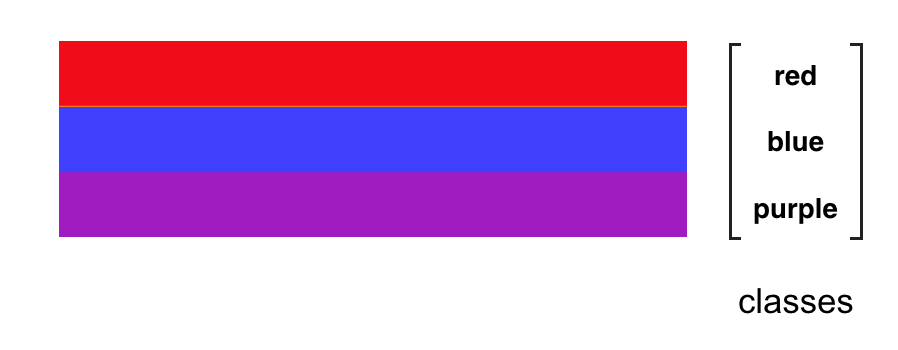
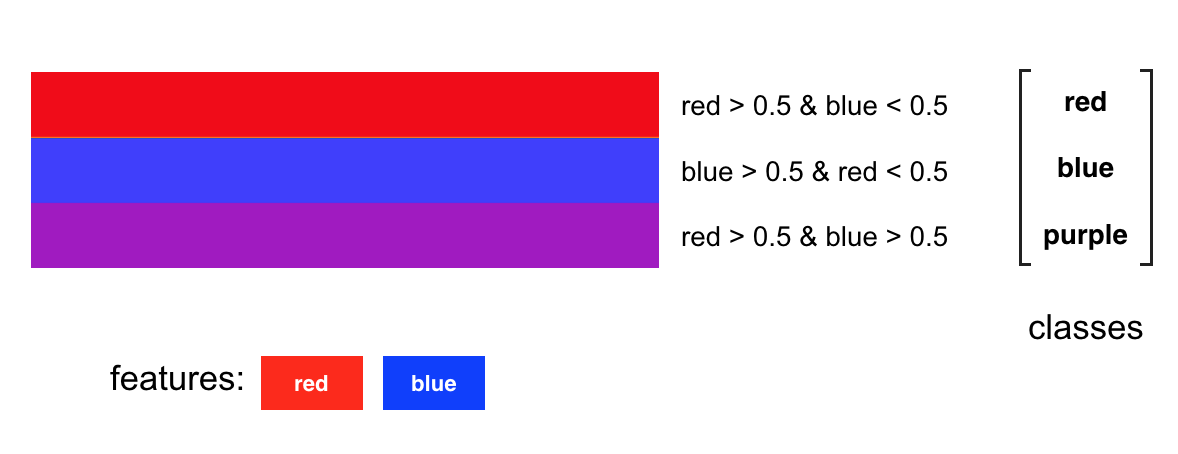
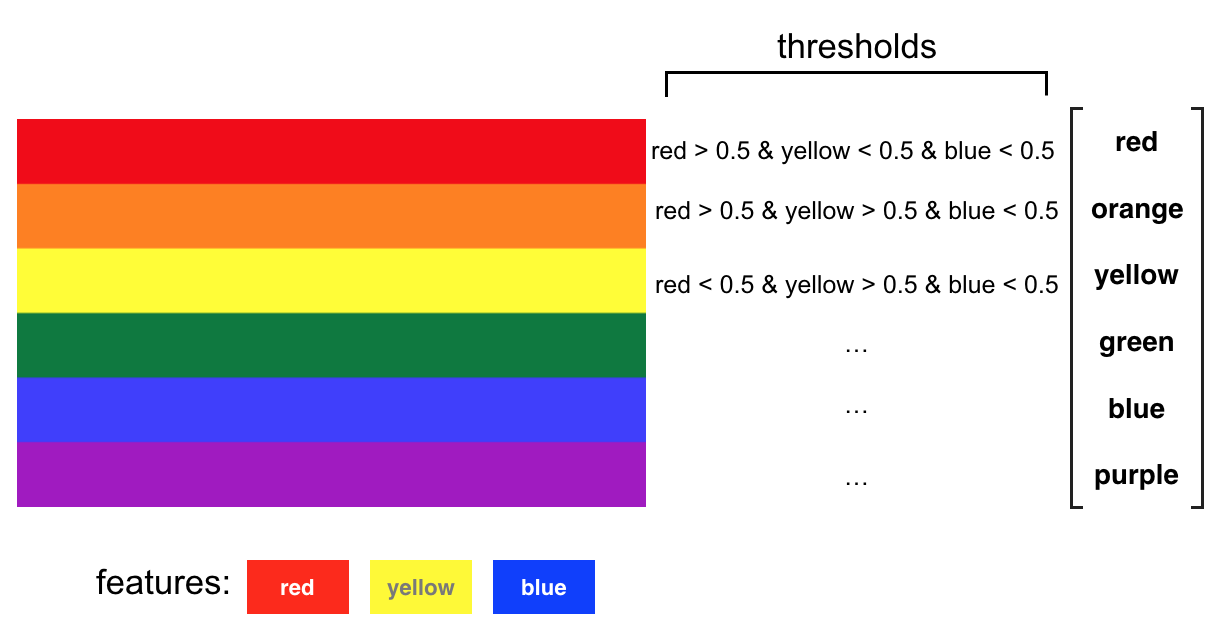
Say, we are given the rainbow above as training data and this corresponding, discrete list of color classes. We want to create a model that will correctly classify all of these given colors and which will be able to classify any new colors that we may see into one of these classes.
I’m going to start by looking at a smaller set of colors, as an example, red, blue, and purple.
We know that purple is a combination of red and blue and so, I can plot each of these colors on a graph that has red on one axis and blue on the other. A purely red color will fall on the red axis, and a purely blue will fall only on the blue axis.
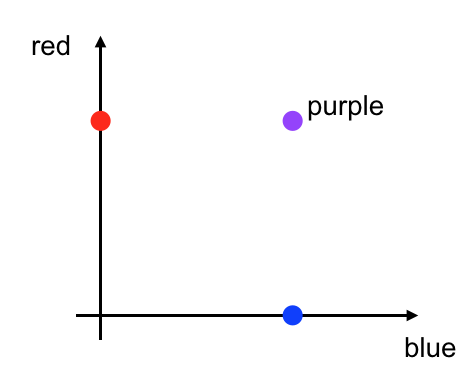
Any color that falls somewhere on this graph has some red component and some blue component, and we can classify any new color that we see by looking at our discrete class options and seeing which of those options best describes that new color. Each new color that we see, should fall into one of our three color classes.
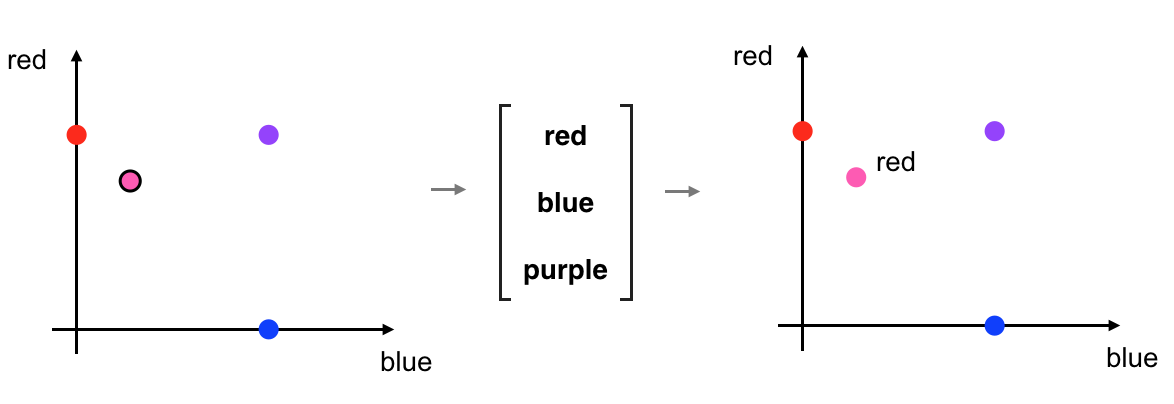
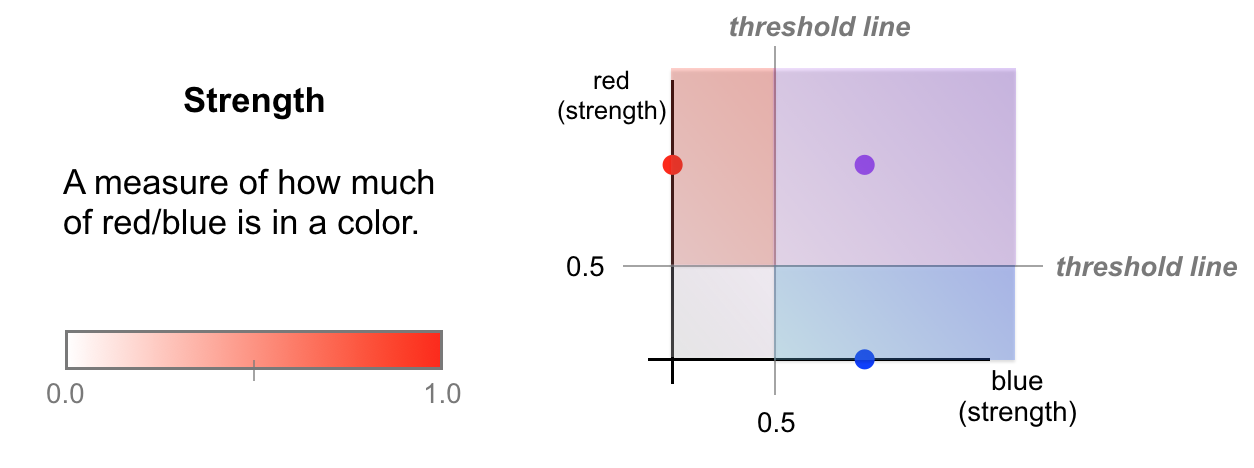
In sorting the above pink-ish color into the red class, I’ve implied that I have some idea of what qualities separate the three color classes. In my head, I’ve actually constructed some thresholds. In the image below, the red and blue axes represent a measure of color strength; how strong the red and blue components of a color are. Strength is a numerical value with a range from 0-1, where 0 is the lowest and 1 is the highest saturation of a color. The thresholds I’ve selected are at the half-strength mark. For example, any color with more than 0.5 strength for red and less than 0.5 strength for blue is going to be classified as red.
Thresholds and Separating Data
What I’ve done here is to define threshold lines that look at the levels of red and blue in a color and then, for any given color, I classify it into one of three color classes based on where it falls on either side of these lines. So, the pink color that you saw earlier, would fall into the red classification area.
One thing to note is that I’ve chosen these threshold lines based on what looks reasonable to my eye, but the job of a neural network is to learn the best threshold lines; maybe a network would learn that red can be captured by a lower threshold.
Keeping these 0.5 strength thresholds in mind, we can write these class-defining thresholds down and make a complete classification model for these colors. Notice that each of the three color classes is defined by only two colors: red and blue, and these are the smaller set of features that make up our color classification model.
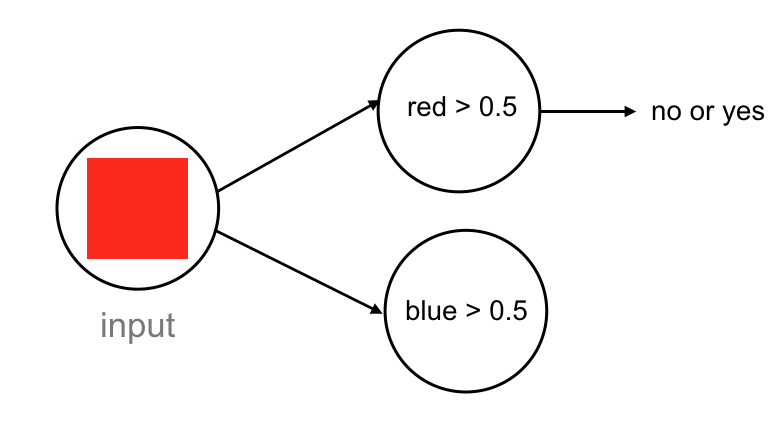
A Complete Neural Network
These thresholds make up a complete neural network. For every input color, we break it into its features: red and blue. Then perform a threshold check: is the red component stronger than 0.5? What about the blue component? For an input color, these threshold nodes have an output: no if a color does not pass, or yes if it does.
I’m skipping over one detail here, which is that this input color will be seen as a series of numerical values by a computer. Most images are color images also called RGB images, with red, green, and blue color components. Any color will typically be a list of three values: one for a red value, one for green, and one for blue. So, the nodes that check for red and blue color components will be looking at those three RGB numerical values; each node will apply a function to those values that convert them into red and blue strength values.
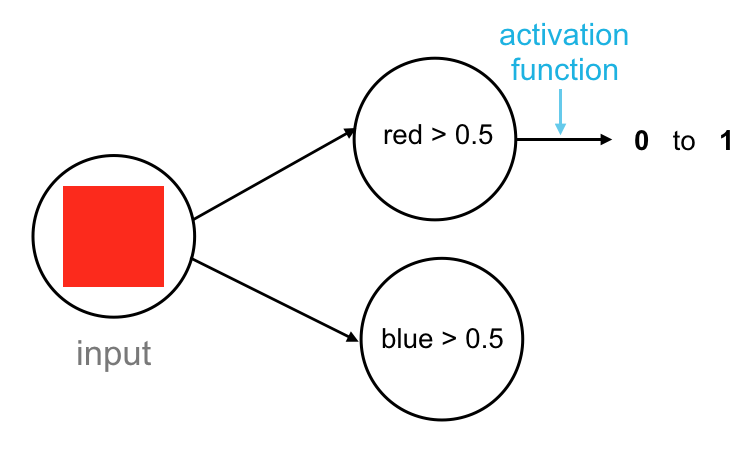
Activation Function
Neural networks really only work with numerical data and so this no or yes output will be a numerical value. In this case, we’ll use a 1 for yes and a 0 for no. We can even represent a “maybe” with a value between 0 and 1. To get a value between 0 and 1, we can apply something called an activation function, which is a function that processes the output of a neuron and scales an output value to fit in some range, such as the range from 0 to 1. In general, these scaled values are a really good and consistent way to measure the strength of any input or output signal and this consistency becomes really helpful when a neural network trains.
The complete network has this structure:
- An input layer that looks at the input color.
- A hidden layer, which can be thought of as a feature extractor that looks at our red and blue features.
- A fully-connected layer, which has as many nodes as there are color classes.
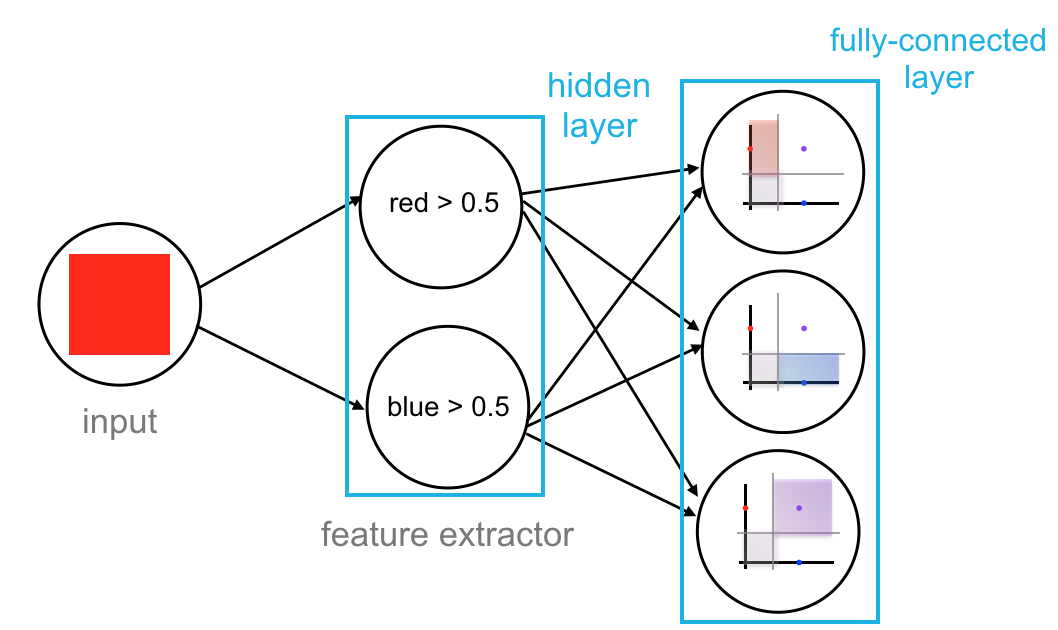
Each node in the fully-connected layer is connected to the output of every previous node, in this case, the outputs from the red and blue threshold nodes.
So, for a red color input, let’s go through what this network does. The network sees that this input color passes the red threshold, but not the blue threshold. The nodes output a 1 and 0, respectively. These output values move forward to the next, fully-connected layer and are seen as inputs. The fully-connected layer has nodes that respond to different combinations of these 1/0 inputs, and sort each combination of 1’s and 0’s into one of our three classes. In this case, the combination of 1 and 0 (red but no blue), causes an output of 1 for the red class. These final output values, similar to the “yes” and “no” threshold outputs, are usually represented by a value between 1 and 0.
Class Scores
These outputs are often called confidence scores or class scores. And you can think of them as probability values where a value of 1 corresponds to a 100% chance of being the correct class and a 0.5 would be a 50% chance of being correct. The higher the score, the more likely a color falls into that class.
This network should be able to handle new colors, those that have some blue and red component, so let’s take dark purple as an example. A dark purple definitely passes the blue threshold, but what about the red? Well, our network sees it and thinks that it is close to passing but it’s not entirely sure, so it may output a value like 0.6 for the red threshold (closer to yes than no). When this value moves through this network, we’ll see that this triggers both the blue and purple class nodes. This would produce class scores with the highest value for the purple class but some small value for blue, as well. So, even with this “maybe” value for the red threshold, it turns out that this color is classified as purple, according to this network.
You might be wondering why I chose these colors, and it’s because this simple example can extend to all the colors in our initial rainbow! To account for some of the warmer colors, we have to add one more feature to our model: yellow. Now, all the colors in this rainbow can be represented by a combination of red, yellow, and blue strengths.
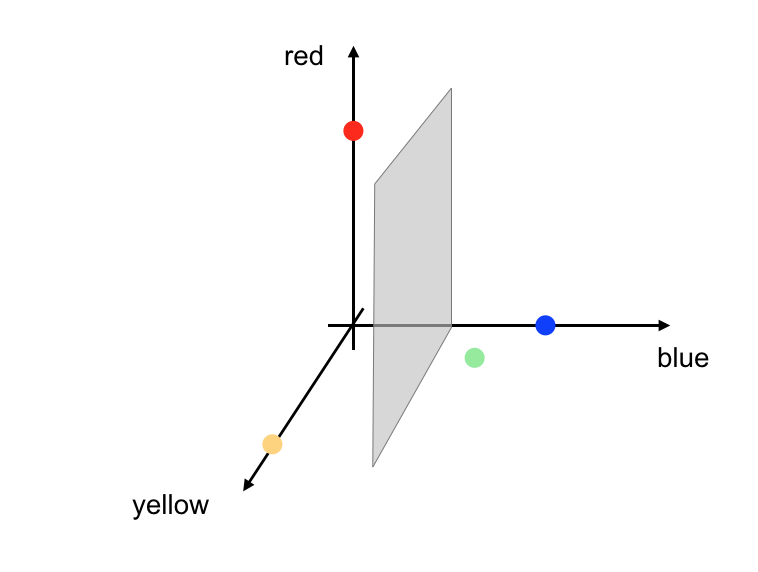
This extra color feature will add a dimension in how we have to separate this data. Instead of a threshold line, we’ll actually end up with threshold planes that separate one color class from another.
Neural Network Summary
Neural networks break up any set of training data into a smaller, simpler model that is made of features. In our rainbow example, all our features were colors. Then a network can learn how to combine those features and create thresholds/boundaries that can separate and classify any kind of data. Realistically, data is often a lot more complex than rainbow color data, but neural networks just layer separation on top of separation layer to create more complex boundaries and group all kinds of data.
If you understand that a model is made of visual features found in training data and that a neural network combines these features, using a series of thresholds, to identify any new data, then you understand how neural networks work!
If you are interested in my work and thoughts, check out my Twitter or connect with me on LinkedIn.